
Mean Median Mode Calculator – Fast & Easy Statistics Tool
Mean Median Mode Calculator
Enter your dataset and get instant statistical analysis. Numbers can be separated by commas, spaces, or line breaks.
Use this Mean median Mode Calculator casio to quickly calculate the most important measures of central tendency in a dataset. Simply enter your values to find the Mean calculator results, including the mean, median, mode, total count, and sum. The tool makes it easy to understand your data without doing the calculations manually.
How to Find the Mean
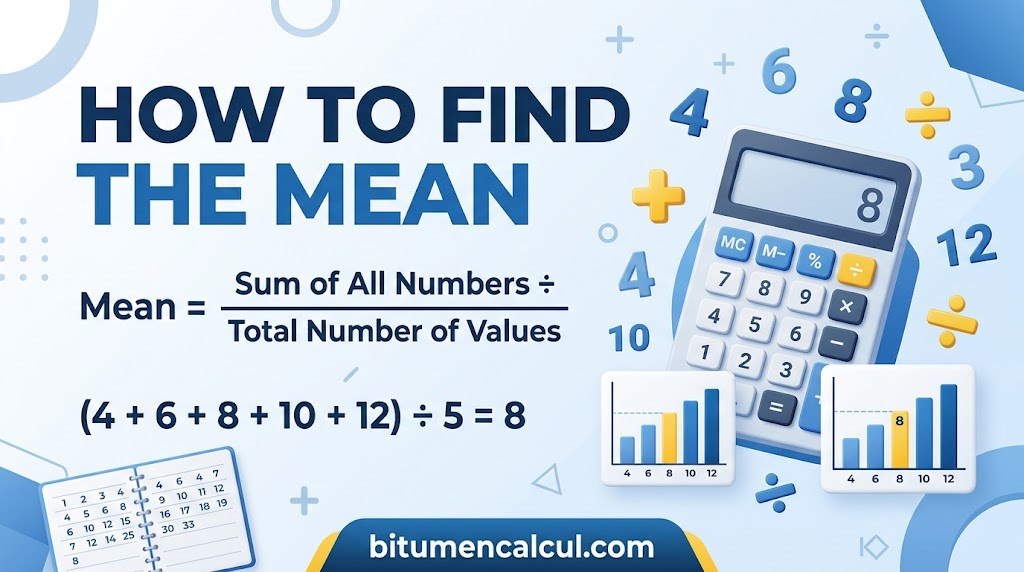
- Add all the values in the dataset together to calculate the total sum.
- Count how many values are included in the dataset.
- Divide the total sum by the number of values.
The mean represents the average value of a dataset. It gives you a single number that summarizes the overall values in the data.
Mean Formula
The mean, represented by x̄, is calculated by dividing the sum of all data values by the total number of values, represented by n.
Mean = Sum of all data values ÷ Number of values
In other words, x̄ = Σx / n, where Σx represents the total of all values and n represents the number of values in the dataset.
How to Find Median

The median is the value that divides a dataset into two equal parts, with half of the data values below it and the other half above it.
- Arrange all data values from the smallest to the largest.
- Find the value located in the middle of the ordered dataset.
- When there are two values in the middle, calculate their mean to determine the median.
Median Example
For the dataset 1, 1, 2, 5, 6, 6, 9, the median is 5 because it is the value in the exact middle of the ordered set.
For the dataset 1, 1, 2, 6, 6, 9, there are two middle values: 2 and 6. Find their average to get the median:
(2 + 6) / 2 = 4
Therefore, the median of this dataset is 4.
Median Formula
When a dataset x₁ ≤ x₂ ≤ x₃ ≤ … ≤ xₙ is arranged from the lowest to the highest value, the median is the data point that separates the lower half from the upper half of the dataset.
If the number of values in the dataset, n, is odd, the median is the value at position p, where:
p = (n + 1) / 2
If n is even, the median is the average of the values at positions p and p + 1, where:
p = n / 2
In this case, the two middle values are added together and divided by 2 to obtain the median.
How to Find the Mode
The mode is the value, or values, that appear most frequently in a dataset. A dataset can have one mode, more than one mode, or no mode when all values occur with the same frequency.
For example, in the dataset 1, 1, 2, 5, 6, 6, 9, both 1 and 6 occur twice. Therefore, the dataset has two modes: 1 and 6. This type of calculation can also be handled easily with a Mean median mode calculator grouped data when working with larger datasets.
Interquartile Range
The interquartile range, or IQR, measures the spread of the middle 50% of values in a dataset. It is found by subtracting the first quartile (Q1) from the third quartile (Q3).
IQR = Q3 − Q1
The IQR is useful for understanding how widely the central values are distributed and is also helpful when identifying possible outliers.
Outliers
Potential outliers are data values that fall outside the expected range of a sample. A value may be considered a potential outlier when it is either above the upper fence or below the lower fence.
Upper Fence = Q3 + 1.5 × Interquartile Range
Lower Fence = Q1 − 1.5 × Interquartile Range
These calculations can be used alongside a Standard deviation calculator to better understand the spread and variation within a dataset. A Mean, median, mode standard deviation Calculator can also help compare different measures of central tendency and data dispersion.
What Are Mean Median and Mode?
Mean, median, and mode are three common measures of central tendency used in statistics. Each one describes the data in a different way and helps identify a value that can be considered typical or representative of a dataset. You can also compare these measures with other statistical values through a Mean median mode calculator percentage tool.
The mean refers to the average of all values in a dataset. To calculate it, add every number together and then divide the total by the number of values included in the dataset.
The median is the middle value when a dataset is arranged in ascending or descending order. When the dataset contains an odd number of values, there is one number directly in the center. When two values fall in the middle, add those two numbers and divide their sum by 2 to get the median.
The mode is the value that appears most often within a dataset. To identify it, check how many times each number occurs and find the one with the highest frequency. A dataset can have more than one mode, while a dataset in which every value appears equally often has no mode. These measures can also be considered alongside Mean, median, mode midrange when analyzing a dataset.
FAQs
Conclusion
Whether you are working with a small dataset or more detailed statistics, understanding the mean, median, mode, IQR, and outliers makes data easier to interpret. A Mean median Mode Calculator casio or Mean calculator can save time, reduce calculation errors, and help you quickly understand the key patterns in your data.
Read More: