Win Rate Calculator for Tracking Wins, Losses and Draws
Win Rate Calculator for Tracking Wins, Losses and Draws
Enter your wins, losses and draws and see your win rate as a percentage, together with your win loss ratio.
Your Record: Wins, Losses and Draws
Quick Check: Wins and Total Games

A win rate calculator turns a raw record of wins, losses and draws into a single percentage that is easy to read and easy to compare. Instead of staring at a list of results and guessing how well you are doing, you enter three counts and get one clear figure: the share of your games that ended in a win. The same calculation works for a ranked gaming season, a league campaign, a chess record full of draws, a sales team’s closed deals or a trader’s log of trades.
The percentage is only the starting point. This page also shows your win loss ratio, your loss rate and your win rate across decisive games only, because each figure answers a slightly different question about your record.
What Is a Win Rate and Why Does It Matter?
A win rate is the percentage of games you have won out of all the games you have played. It compresses an entire record into one number, which is why it has become the standard performance figure in esports, video games, board games and traditional sports. A win rate of 60% carries a simple meaning: on average, you win six out of every ten games you play. A win percentage calculator is another name for the same tool, and this page works as both.
The figure matters because raw counts mislead. A player with 90 wins sounds stronger than one with 45 wins, until you learn that the first needed 200 games to reach 90 while the second reached 45 in only 60 games. The win rate corrects for volume: the 45 win player wins 75% of the time, the 90 win player only 45%.
How to Use the Win Rate Calculator
The calculator needs nothing more than the three counts from your record, and it updates as you type:
- Count your wins from the record you want to measure: a season, a ranked split or a tournament run.
- Count your losses from exactly the same stretch. Mixing periods, such as this season’s wins with last season’s losses, produces a number that describes neither.
- Count your draws or ties, if your game produces them. Leave the field at zero where every match has a winner.
- Read the results: total games, win rate, loss rate, draw rate and win loss ratio.
- If you only know your wins and your total games, use the quick check part of the calculator instead. Enter the two numbers and it works out your losses and win rate for you.
The Inputs Explained: Wins, Losses, Draws and Total Games
Wins are the games in your record that ended in a result credited to you or your team. Only count games from the same record: a win rate built from ranked wins and casual losses measures a mixture no season produced.
Losses are the games that ended in defeat. When a record has no draws, losses are simply the total games minus the wins, which is why the quick check part of the calculator can find them from those two numbers alone.
Draws, also called ties, are games that end with neither side winning. A draw is part of your total games but not a win, so including draws lowers the win rate compared with counting only games that produced a result. How draws are treated is the biggest choice in this calculation, covered in full further down.
Total games is the denominator of the whole calculation: wins plus losses plus draws. It must be greater than zero, because a win rate built on no games at all does not exist yet.
Key Terms: Win Rate, Loss Rate, Win Loss Ratio and Decisive Games
Win rate is wins divided by total games, multiplied by 100 and expressed as a percentage. It always sits between 0% and 100%.
Loss rate is the mirror figure: losses divided by total games, multiplied by 100. With no draws in a record, win rate and loss rate add up to exactly 100%. When draws are present, the two figures leave a gap, and that gap is the draw rate.
Win loss ratio compares your wins directly with your losses and ignores draws completely. It is found by dividing wins by losses. A ratio of 3.75 means you win 3.75 games for every game you lose. A standalone win loss ratio calculator reports only this figure, while the tool above gives it together with your win rate.
Decisive games are the games that produced a winner: wins plus losses, with draws removed. A win rate over decisive games only answers a narrower question: when a game reaches a result, how often is that result a win for you? Draw heavy formats such as chess often prefer this version.
Win Rate Formulas
Every figure on this page comes from a short set of formulas, each using the same three counts.
Total games = wins + losses + draws
The full size of the record, and the denominator for the percentages below.
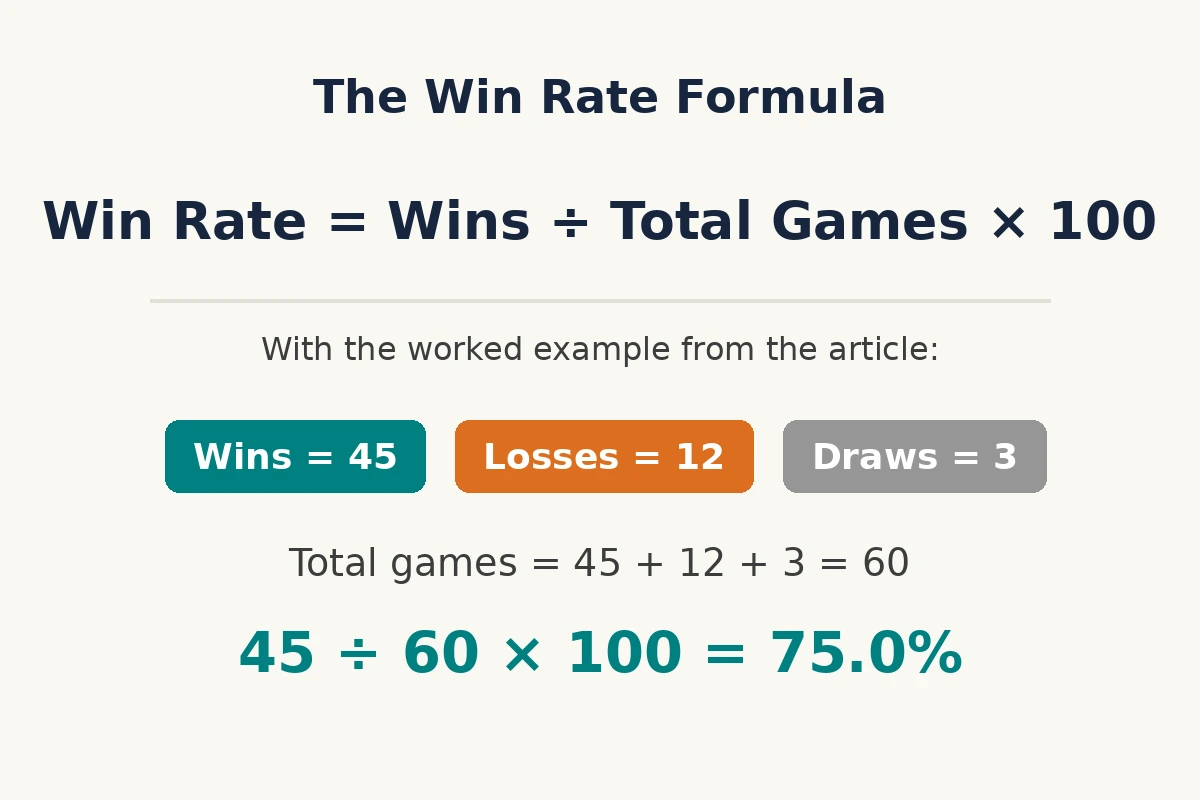
Win rate (%) = (wins ÷ total games) × 100
The share of all games played that ended in a win.
Loss rate (%) = (losses ÷ total games) × 100
The share of all games played that ended in a loss.
Win loss ratio = wins ÷ losses
How many wins you record for each loss. If losses are zero the ratio cannot be divided out, and the honest summary is that you are unbeaten.
Win rate in decisive games (%) = (wins ÷ (wins + losses)) × 100
The same idea with draws removed, so only games with a winner count.
Winning percentage with draws as half a win (%) = ((wins + 0.5 × draws) ÷ total games) × 100
A long standing sports convention, used by leagues such as the NFL since 1972, which credits each draw as half a win.
Worked Example: 45 Wins from 60 Games
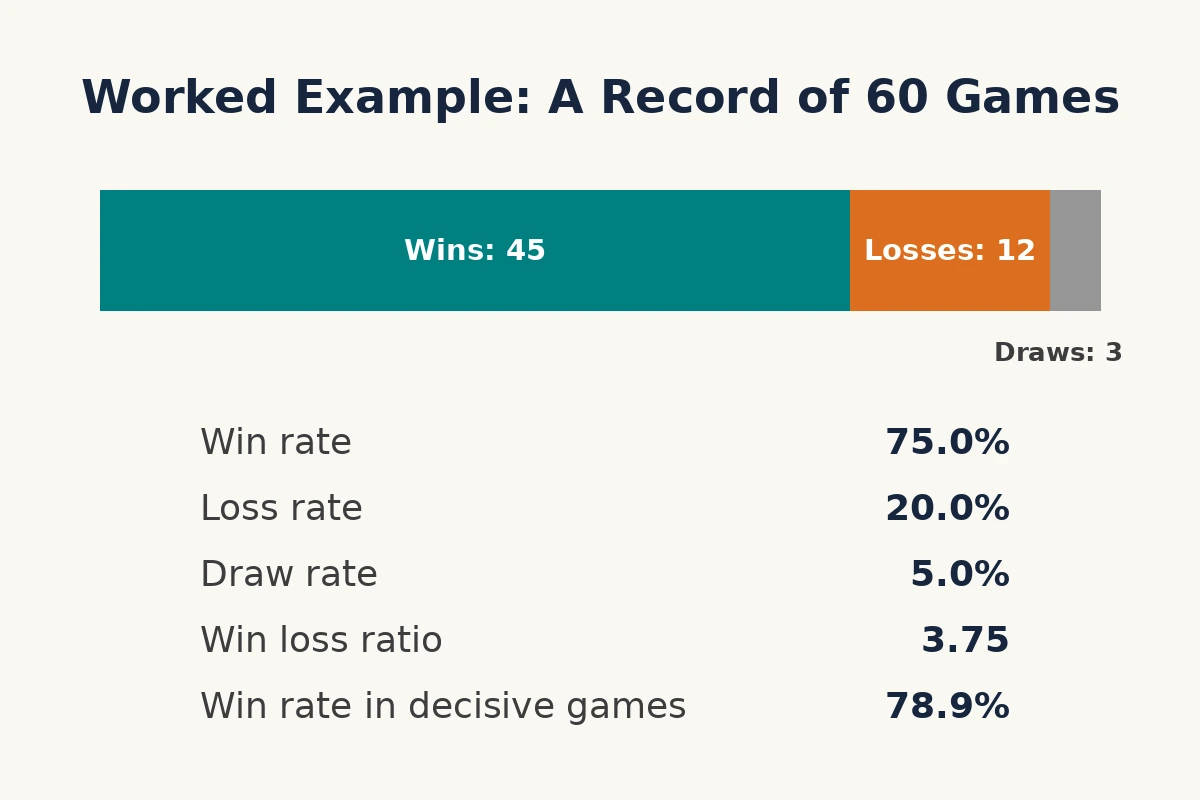
Take a realistic season record: 45 wins, 12 losses and 3 draws. Running those counts through the formulas:
- Total games: 45 + 12 + 3 = 60 games.
- Win rate: 45 ÷ 60 = 0.75, and 0.75 × 100 = 75.0%. Three out of every four games ended in a win.
- Loss rate: 12 ÷ 60 = 0.20, which is 20.0%. With a draw rate of 3 ÷ 60 = 5.0%, the three figures account for the whole record: 75% + 20% + 5% = 100%.
- Win loss ratio: 45 ÷ 12 = 3.75. For every game this player loses, they win 3.75 games.
- Win rate in decisive games: the draws leave 45 + 12 = 57 decisive games, and 45 ÷ 57 = 0.789, which is 78.9%.
- Draws counted as half a win: (45 + 0.5 × 3) ÷ 60 = 46.5 ÷ 60 = 0.775, which is 77.5%, sitting between the plain win rate and the decisive games figure, exactly as a compromise should.
Notice how the same record honestly produces three different percentages: 75.0%, 77.5% and 78.9%. None is wrong. They answer three different questions about how draws should count, which is why the method matters as much as the arithmetic.
Win Rate Across Common Records
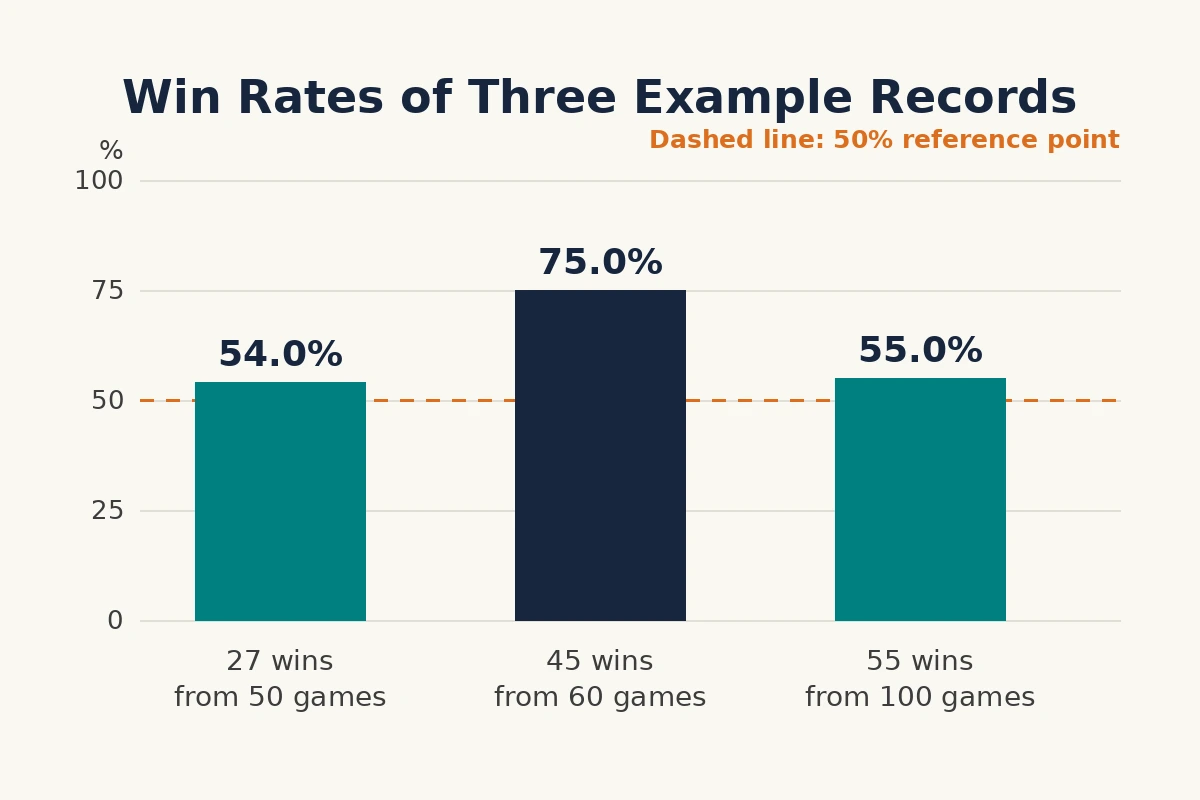
The table below applies the main formula to records that come up often, so you can place your own result quickly. The win rate uses all games played as the denominator.
| Wins | Losses | Draws | Total Games | Win Rate |
|---|---|---|---|---|
| 3 | 2 | 0 | 5 | 60.0% |
| 7 | 13 | 0 | 20 | 35.0% |
| 20 | 15 | 5 | 40 | 50.0% |
| 27 | 23 | 0 | 50 | 54.0% |
| 45 | 12 | 3 | 60 | 75.0% |
| 55 | 45 | 0 | 100 | 55.0% |
| 110 | 90 | 0 | 200 | 55.0% |
Two rows deserve a second look. The records of 55 wins from 100 games and 110 wins from 200 games share the same 55.0% win rate, yet the second rests on twice as much evidence and is far more likely to reflect the player’s true level. Always read a percentage next to its total.
How Draws and Ties Change the Result
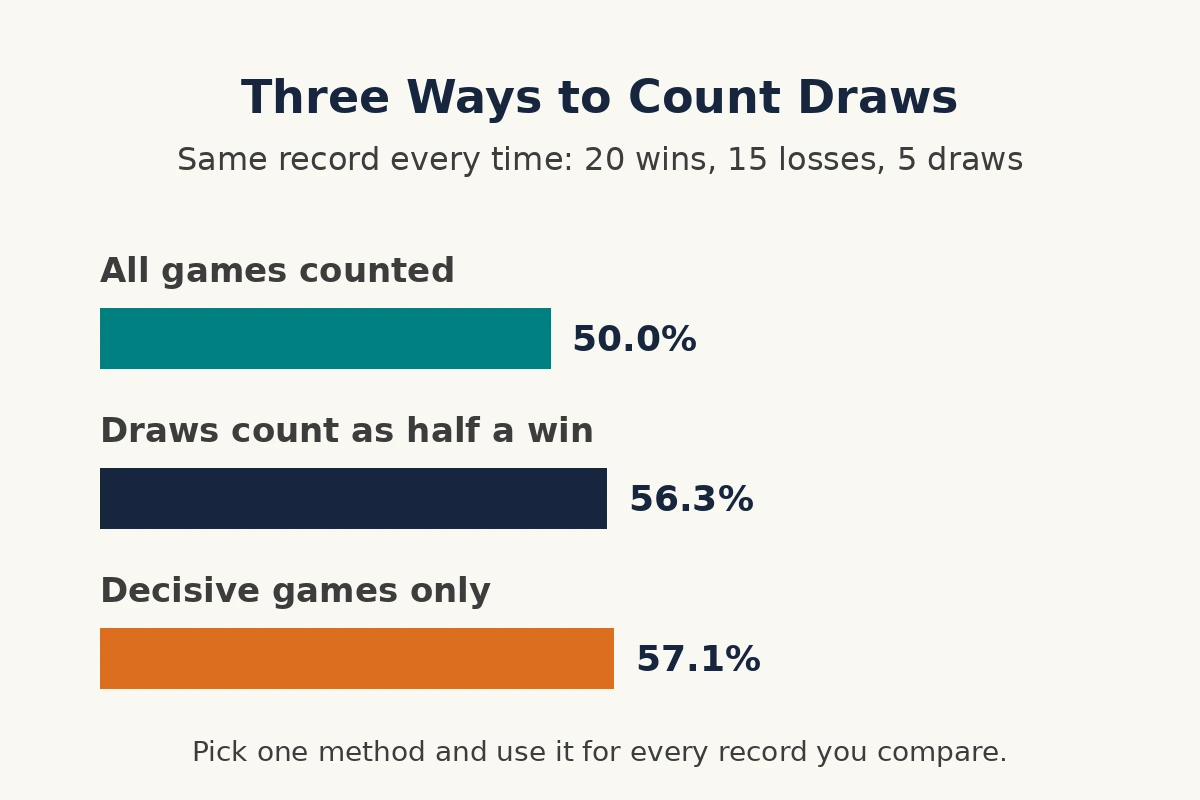
Draws are where win rate calculations quietly split into different answers, so the treatment has to be a deliberate choice. Consider a record of 20 wins, 15 losses and 5 draws. Counting every game played gives 20 ÷ 40 = 50.0%. Judging only decisive games gives 20 ÷ 35 = 57.1%. Crediting each draw as half a win gives (20 + 2.5) ÷ 40 = 56.3%. One record, three defensible percentages, spread across more than seven points.
None of the three is the true one in isolation. Including draws tells you how often you win a game you start. Decisive games only tells you how often you win a game that finishes with a winner. The half win method rewards you partly for not losing, which is why standings based leagues favour it. Switching methods between two records you are comparing is not defensible, because the gap between methods can exceed the gap between the players. Pick one method and use it throughout.

What Counts as a Good Win Rate?
The honest answer is that it depends on the field the record was earned in. In rating based matchmaking systems such as Elo or MMR ladders, the matchmaker pairs you with opponents of similar strength, which pushes everyone toward 50% over time. In that setting a rate held above 50% across many games means you are still climbing, a rate near 50% means you have settled at your current level, and strong players often sit between 55% and 60%.
Outside matchmaking, benchmarks come from the activity itself. In sales, a win rate above 40% on closed opportunities is generally read as strong, 20% to 40% as typical, and below 20% as weak. In trading, good depends on average win size against average loss size: a strategy that makes twice what it loses per trade breaks even at only 33.3%.
The last word belongs to sample size. A 75% win rate over 20 games can come from an even player on a lucky run, while the same rate over 500 games is serious evidence of an edge. Treat any win rate built on fewer than about 30 games, or about 50 trades, as an early indication rather than a measurement.
Common Win Rate Mistakes
- Using the wrong denominator. Dividing wins by wins plus losses, with draws left uncounted, inflates the figure and breaks comparisons with anyone who counted all games.
- Mixing records. Combining ranked and unranked games, or two seasons or game modes, produces one blended percentage that describes none of them accurately.
- Trusting tiny samples. Ten games can make an average player look elite or hopeless. Small records swing wildly, so wait for volume before concluding anything.
- Comparing across methods. A decisive games win rate almost always beats an all games win rate from the same record, so comparisons are meaningless unless both sides used the same method.
- Reading the percentage as pure skill. Win rate says nothing about opponent strength, team contribution or the difficulty of the games played. It summarises results, and results are only part of performance.
FAQs
Conclusion
A win rate is one division away: wins over total games, times 100. The number becomes genuinely useful when you know which games stood behind it, how its draws were counted and how it compares with your loss rate and win loss ratio. Enter your record above, pick the method that matches your question, and you have a figure you can track and trust. Whether you arrived here looking for a winning percentage calculator for sports, gaming or trading, the method behind the number is the same.