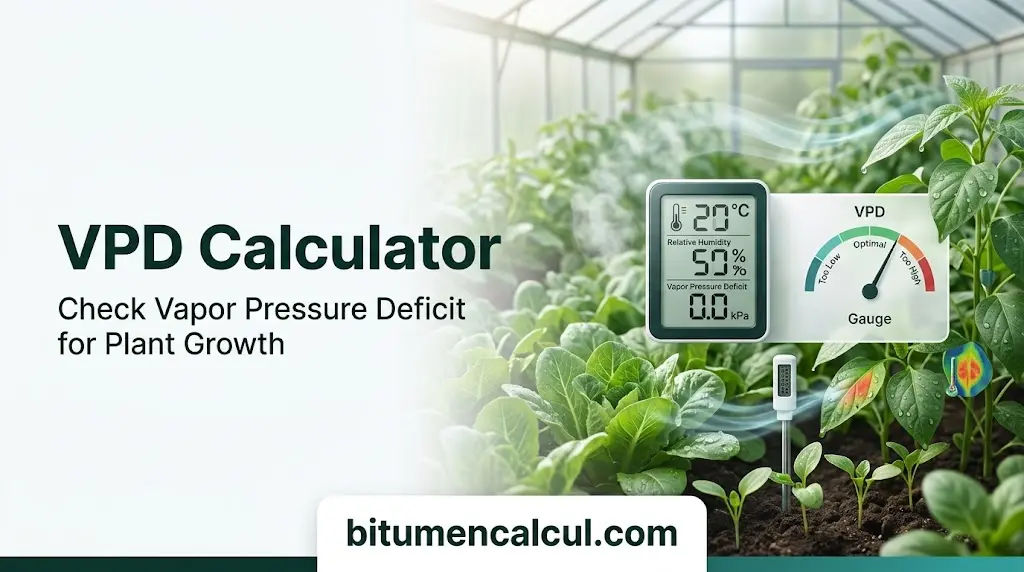
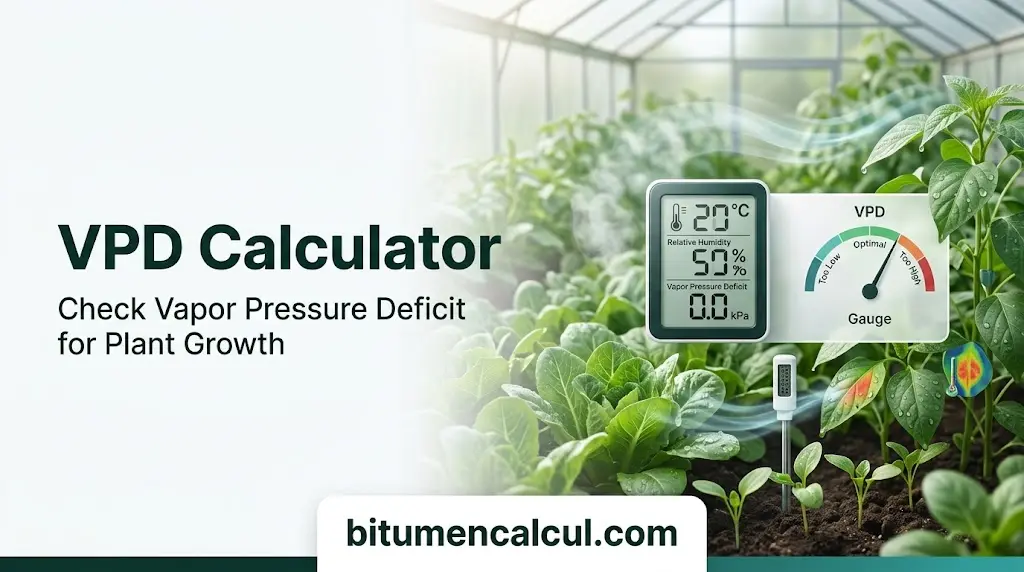
VPD Calculator Check Vapor Pressure Deficit for Plant Growth
VPD Calculator
Calculate Vapor Pressure Deficit from air temperature and relative humidity.
VPD Reference Ranges
| Range (kPa) | Typical Meaning |
|---|---|
| Below 0.4 | Too humid – condensation and mold risk |
| 0.4 – 0.8 | Low – suits seedlings, clones and propagation |
| 0.8 – 1.2 | Ideal for most plants in vegetative growth |
| 1.2 – 1.6 | High – suits late flowering and fruiting |
| Above 1.6 | Too dry – plant stress and excess water loss |
Calculate vapor pressure deficit (VPD) using temperature and humidity, compare your growing conditions with the healthy range for your crop, and explore the complete VPD chart. Designed for growers, the tool also accounts for leaf VPD and growth stage to help you better understand your plants’ environmental conditions.
What VPD Tells You
VPD (Vapor Pressure Deficit) measures how much more water vapor the air can hold before reaching saturation. It is more than just a background reading: VPD influences transpiration, affects when stomata open, and helps transport calcium through the plant. These processes influence everything from growth rates to blossom end rot.
When VPD drops too low, the air becomes overly humid, increasing the risk of condensation and fungal diseases. When VPD rises too high, plants may close their stomata, restricting water and nutrient movement and slowing growth.
How This VPD Calculator Works
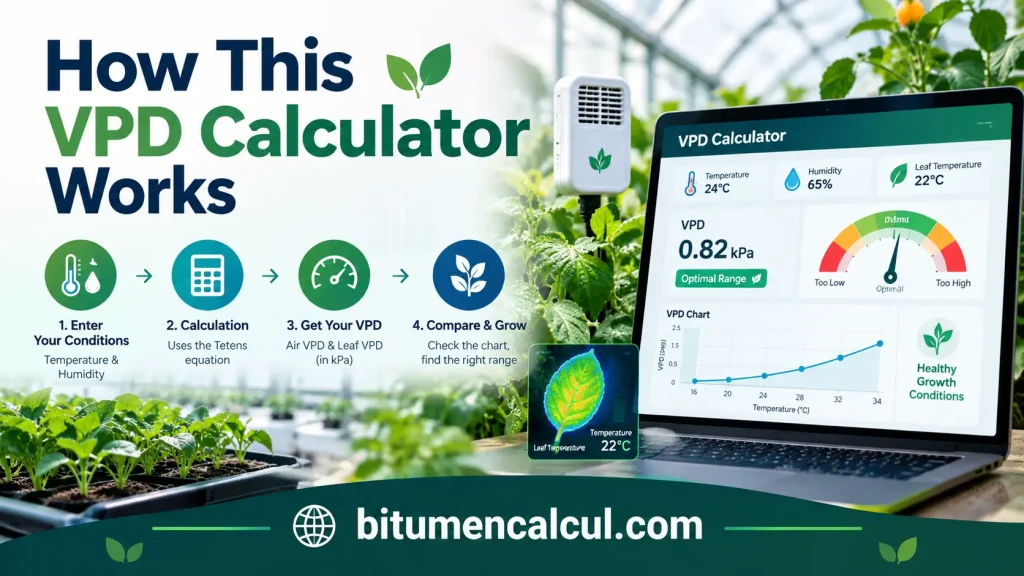
The VPD calculator uses the Tetens equation to calculate saturation vapor pressure and provides two key measurements. Air VPD is calculated using air temperature, while Leaf VPD accounts for leaf temperature, reflecting the conditions the plant actually experiences. Since a leaf exposed to direct radiation can be several degrees warmer or cooler than the surrounding air, leaf VPD is often the more useful value to monitor when managing growing conditions. Adjust the leaf temperature offset to suit your crop, or measure the actual leaf temperature using the Sigrow Stomata Camera.
VPD Chart: The Ranges to Aim For
The ranges below are shown on the gauge and VPD chart above. They represent the recommended working range from the Plant Empowerment approach for most fruiting vegetables. Younger plants generally prefer a lower VPD, so use the growth-stage selector to adjust the target range.
VPD Chart in Degrees Celsius (kPa)
| °C \ RH | 50% | 55% | 60% | 65% | 70% | 75% | 80% | 85% | 90% | 95% |
|---|---|---|---|---|---|---|---|---|---|---|
| 16°C | 0.91 | 0.82 | 0.73 | 0.64 | 0.55 | 0.45 | 0.36 | 0.27 | 0.18 | 0.09 |
| 18°C | 1.03 | 0.93 | 0.83 | 0.72 | 0.62 | 0.52 | 0.41 | 0.31 | 0.21 | 0.10 |
| 20°C | 1.17 | 1.05 | 0.94 | 0.82 | 0.70 | 0.58 | 0.47 | 0.35 | 0.23 | 0.12 |
| 22°C | 1.32 | 1.19 | 1.06 | 0.93 | 0.79 | 0.66 | 0.53 | 0.40 | 0.26 | 0.13 |
| 24°C | 1.49 | 1.34 | 1.19 | 1.04 | 0.90 | 0.75 | 0.60 | 0.45 | 0.30 | 0.15 |
| 26°C | 1.68 | 1.51 | 1.34 | 1.18 | 1.01 | 0.84 | 0.67 | 0.50 | 0.34 | 0.17 |
| 28°C | 1.89 | 1.70 | 1.51 | 1.32 | 1.13 | 0.94 | 0.76 | 0.57 | 0.38 | 0.19 |
| 30°C | 2.12 | 1.91 | 1.70 | 1.49 | 1.27 | 1.06 | 0.85 | 0.64 | 0.42 | 0.21 |
| 32°C | 2.38 | 2.14 | 1.90 | 1.66 | 1.43 | 1.19 | 0.95 | 0.71 | 0.48 | 0.24 |
| 34°C | 2.66 | 2.39 | 2.13 | 1.86 | 1.60 | 1.33 | 1.06 | 0.80 | 0.53 | 0.27 |
VPD Chart in Degrees Fahrenheit (kPa)
| °F \ RH | 50% | 55% | 60% | 65% | 70% | 75% | 80% | 85% | 90% | 95% |
|---|---|---|---|---|---|---|---|---|---|---|
| 60°F | 0.88 | 0.80 | 0.71 | 0.62 | 0.53 | 0.44 | 0.35 | 0.27 | 0.18 | 0.09 |
| 64°F | 1.02 | 0.92 | 0.81 | 0.71 | 0.61 | 0.51 | 0.41 | 0.31 | 0.20 | 0.10 |
| 68°F | 1.17 | 1.05 | 0.94 | 0.82 | 0.70 | 0.58 | 0.47 | 0.35 | 0.23 | 0.12 |
| 72°F | 1.34 | 1.21 | 1.07 | 0.94 | 0.80 | 0.67 | 0.54 | 0.40 | 0.27 | 0.13 |
| 76°F | 1.53 | 1.38 | 1.23 | 1.07 | 0.92 | 0.77 | 0.61 | 0.46 | 0.31 | 0.15 |
| 80°F | 1.75 | 1.57 | 1.40 | 1.22 | 1.05 | 0.87 | 0.70 | 0.52 | 0.35 | 0.17 |
| 84°F | 1.99 | 1.79 | 1.59 | 1.39 | 1.19 | 0.99 | 0.80 | 0.60 | 0.40 | 0.20 |
| 88°F | 2.26 | 2.03 | 1.81 | 1.58 | 1.36 | 1.13 | 0.90 | 0.68 | 0.45 | 0.23 |
| 92°F | 2.56 | 2.31 | 2.05 | 1.79 | 1.54 | 1.28 | 1.02 | 0.77 | 0.51 | 0.26 |
VPD range guide:
- Too low: Below 0.3 kPa
- Comfortable: 0.3 to 0.6 kPa
- Optimal: 0.6 to 1.2 kPa
- High: 1.2 to 1.5 kPa
- Too high: Above 1.5 kPa
The chart above shows air VPD, calculated using air temperature and relative humidity alone. It provides a useful starting point, but it does not fully represent the climate experienced by the plant. For a more accurate picture, measure conditions within the crop canopy rather than near the door or high up in the greenhouse gutter. The Air+ greenhouse climate sensor records temperature and humidity at canopy height, helping you monitor the air surrounding your plants.
Leaves are usually slightly cooler than the surrounding air, so leaf VPD is generally lower than air VPD. Adjust the leaf-temperature offset in the calculator to see how this changes the result. Many VPD charts assume a fixed offset and estimate leaf VPD accordingly. The Sigrow Stomata Camera measures the actual temperature of the leaves, allowing you to manage conditions using measured leaf VPD rather than an estimate.
- Below 0.3 kPa: Conditions are too wet. The air is close to its dew point, increasing the risk of condensation and Botrytis.
- 0.3 to 0.6 kPa: A mild, forgiving range that suits young plants, cuttings, and propagation.
- 0.6 to 1.2 kPa: The ideal range for most fruiting vegetables. Transpiration and CO2 uptake can both remain active.
- 1.2 to 1.5 kPa: Conditions are on the dry side. Many crops can tolerate this range, but sensitive varieties should be monitored for signs of stress.
- Above 1.5 kPa: Conditions are too dry. Plants may close their stomata, reducing photosynthesis and limiting calcium transport.
How to Measure VPD in Your Greenhouse
A VPD calculator or chart shows the conditions at a specific place and moment. However, a real greenhouse can have many different microclimates at once, from the main aisle and crop canopy to humid pockets beneath a closed screen. To manage VPD effectively, you need to measure conditions where your plants grow and monitor them continuously.
The Sigrow Pixel continuously measures conditions at crop level. The Stomata Camera goes a step further by measuring leaf temperature and actual leaf VPD directly from the plant. This is the difference between simply calculating VPD and using real measurements to guide your greenhouse climate management.
FAQs
Conclusion
Overall, a VPD calculator helps growers understand how temperature, humidity, and leaf conditions affect plant health and growth. By checking the VPD chart, adjusting targets according to the growth stage, and monitoring conditions at crop level, you can maintain a more suitable growing environment, support transpiration and nutrient transport, and reduce the risks associated with excessively high or low VPD.
Read More: